Updated FDA 483 citations analytics tool
This popular blog has been updated with the latest FDA inspection data. As we all know there has been an increasing regulatory emphasis on the importance of Quality Metrics. Where there is a demand, there will also follow a supply. Just in time, QikSolve has updated their free tool that scrapes data from various websites and databases and provides a way to trend, track, report and visualise all FDA 483 inspection citations from as far back as 2008 through to 2024 and 2025.
In this blog we will demonstrate the use of this tool to analyse the FDA citation data.
Pharmaceutical Industry Data Analysis
This large-scale accumulation of vast amounts of information known as ‘Big Data’ enables the collection and integration of both structured and unstructured data from sources that are typically disconnected. It also makes it possible to identify trends that would have been difficult to detect using traditional manual methods.
In this example, individual FDA citations over several years are grouped into clear, measurable categories. This type of “Big Data” analysis is a key aspect of Industry 4.0, referred to in our field as ‘Pharma 4.0’.
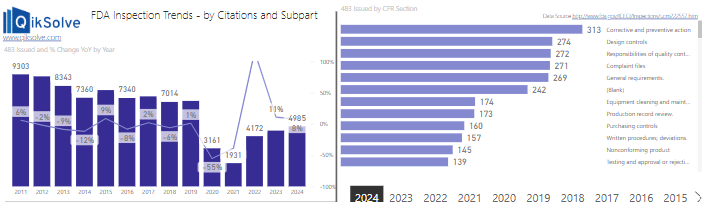
Image 1 – FDA 483 Inspections & Citation Trends
This form of visual analytics helps to present big data in an intelligent format. While these examples are for education purposes only, the presentation of large amounts of data in an easily-interpreted visual format can help you to make business decisions based on the ‘real world evidence (hard evidence) instead of mere guesswork. Known as ‘Data Driven Business,’ it is a huge component of Pharma 4.0 strategies.
Many of the new technologies springing up in the Pharma 4.0 space follow along this metrics pathway.
Customization is available.
- If you can imagine a data tracker similar to that designed by QikSolve, only configured and customised for your individual company, it would allow you to track individual trends, problems or deviations within your facility.
- This data analysis tool would make it far easier to address any emerging issues early, instead of getting caught out by an official auditor during an inspection!
Using this FDA tracker as an example, we could look at the top FDA 483 citations / trends for specific periods of time.
In the image below, it is clear to see the notable increase in the number of FDA 483 citations relating to CAPA systems.
Image 2 – FDA Citations (CAPA Systems & Change Control)
Looking back at current and historical data covering FDA inspections, CAPA systems have remained at the top of the 483 citations list for well over a decade. Design Control is also frequently cited by FDA Inspectors.
FDA 483 citations data continues to demonstrate that CAPAs, Change Control systems and Design Controls are frequently targeted during FDA inspections:
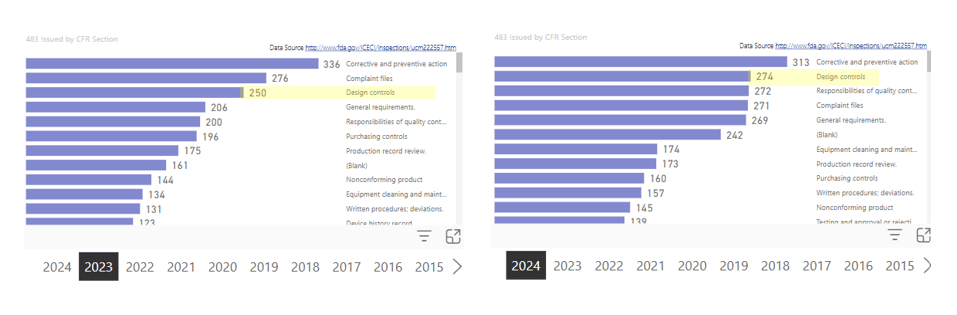
Images 3 & 4 – FDA Citations Design Controls
- The FDA citations trends data depicted below reveals changes in the number of FDA citations related to inadequate Design Controls.
- Design control citations were up nearly 10% (9.6%) between 2023 and 2024.
(Historical citation trends data shown below – 2006 to 2017):

In recent years, FDA inspection trends reveal a continuing focus on Complaints Systems as well as the frequently cited areas of non-compliance mentioned above.
Images 5 & 6 – Subpart F (FDA Citation trends)
However, that isn’t the limit of the 483 citations trends tool.
Imagine if you wanted to more closely examine the citations for Subpart F- Production and Process Controls (shown in the FDA 483 citation trends analysis image below).

Going further into the Production and Process Controls category you can see that the top offender is Written procedures and deviations :
When comparing current 483 citation trends to historical data (refer to image below), it’s clear that written procedures, deviation management, and inadequate control of microbiological contamination have consistently ranked among the top FDA citation areas under Subpart F – Production and Process Controls.
(Historical citation trends data shown below – 2006 to 2017):

Images 7 & 8 – Detailed visualization of citation trends
Not only can you drill down into citation trends over time, but moving to the 3rd page of the metrics display allows even more detail from that CFR section to be visualised.
For example, the images shown below depict the number and class of the citations handed out within CFR Part 820, Subpart F – Production and Process Control category, relating to Part 820.30 – Design Control:
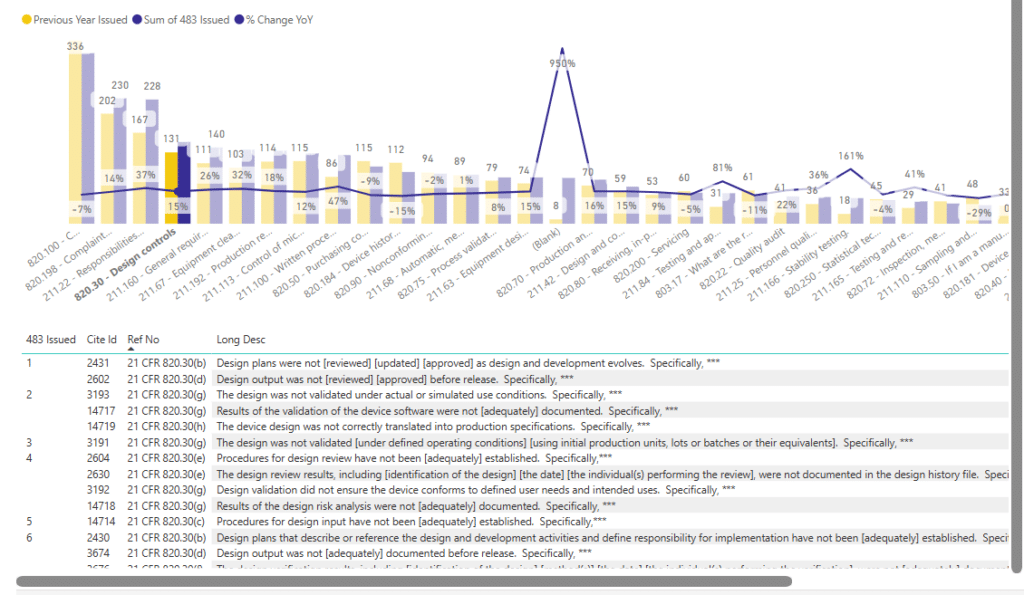
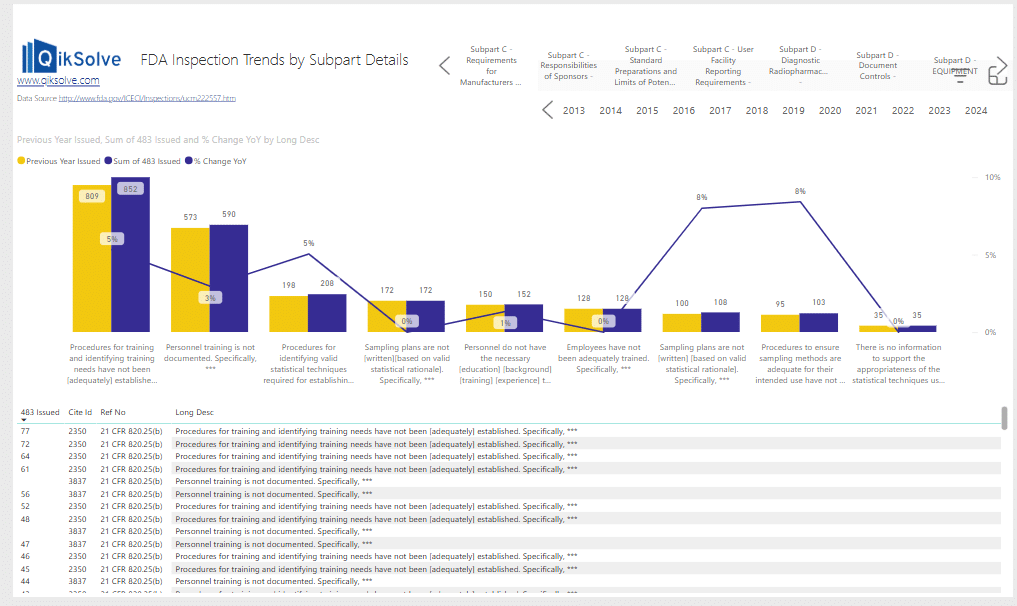
Image 9 – Individual citations within Production and Process Controls (CFR 211.10 example).
The example below depicts a year when there were 91 FDA 483 citations handed out for 21 CFR 211.100(a) non-compliance – “There are no written procedures for production and process controls designed to assure that the drug products have the identity, strength, quality and purity they purport or are represented to posses”.
This example demonstrates the level of detail achieved when you click the ‘drill down ‘ button on the 483 citation trends data visualisation tool.

Summary
From these images alone, it becomes apparent very quickly that if this kind of technology were applied to a typical manufacturing facility, you would be able to trend and visualise large amounts of data from different sources instantaneously. You would be able to keep better track of: environmental monitoring trends, deviations and non-conformances, quality matrices, customer complaints, batch release, etc., the list is endless!
You can view the specific displays for Biologics, Devices, Drugs, or all 3 by clicking on the appropriate links.
To find out more about Pharma 4.0 and the kind of technologies that are available, read more about it in our blogs and come along to the 2026 Pharma & Device Forum (GMP) Forum in March 2026 in Melbourne, Australia!
If you are interested in Industry 4.0 or Pharma 4.0, join us on the Pharma 4.0 LinkedIn Group.
For more examples of the technologies that are available, Microsoft offers PowerBI with a AI or machine learning “included.” It’s hard to explain but fortunately a video will help!